Older Homes and Asbestos Risk Across America's Largest Metros
Written by Tara Strand on November 4, 2026
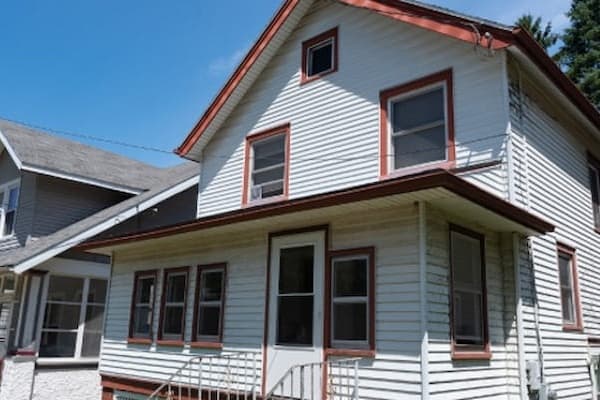
In many of the country's biggest metro areas, most homes were built before 1980. At that time, asbestos was still common in floor tiles, insulation, siding, and other building materials. These asbestos-containing materials can pose health risks when they're damaged or disturbed, causing fibers to become airborne. In older homes, this can happen during renovations, repairs, or simply through ordinary wear.
How We Reported This
We ranked 75 of the largest U.S. metros by the age of their homes and how many are vacant and off the market to see where older housing is most concentrated. We used data from the U.S. Census Bureau, including its American Community Survey (2020 – 2024 five-year estimates) for home ages and vacancies and its Building Permits Survey (2025) for new construction.
Our index combines three measures: the share of homes built before 1980, the share built before 1960, and the share of homes sitting vacant and off the market. We didn't test for asbestos in any specific home. Home age is a stand-in for the possibility that older materials are present.
What We Found
- Half of the homes in 75 of the largest U.S. metros were built before 1980, when asbestos was still commonly used.
- Buffalo, NY, has the oldest housing of any major metro area, with more than 3 in 4 homes (77%) built before 1980.
- McAllen, TX, and Las Vegas, NV, have the newest housing, with fewer than 1 in 5 homes (18%) built before 1980.
- The Northeast has the oldest homes. There, the share of housing built before 1980 stands at 70%, which is nearly double the share in the South at 36%.
- New Orleans, LA, had the highest share of homes classified as vacant and off the market (7.7%), followed by Birmingham, AL (7.5%), Baton Rouge, LA (6.4%), Columbia, SC (5.8%), and Memphis, TN (5.2%).
The Old-and-Idle Home Index: Where Older and Vacant Housing Overlap
To see where aging housing and off-market vacancies overlap, we combined three measures into a single score from 0 to 100. Half of the score comes from the share of homes built before 1980. The share built before 1960 and the share of homes vacant and off the market each account for 25%. Higher scores indicate metros with older housing and more off-market vacancies.

Across the 75 metros studied, half of all homes were built before 1980, when asbestos was still widely used in construction materials. In 30 metros, these older homes make up the majority of the housing stock. The share varies widely from metro to metro, from more than three-quarters of homes in the oldest markets to fewer than 1 in 5 in the newest.

Buffalo, Pittsburgh, and Cleveland had the three highest index scores. These metros are in the Northeast and Midwest, where older housing and off-market vacancies overlap. Scores were generally lower among the other metros studied.

The Northeast and Midwest accounted for 9 of the 10 highest-scoring metros on the Old-and-Idle Home Index. At the other end of the ranking, Sun Belt metros generally had newer housing and fewer homes vacant and off the market. Austin, TX, had the lowest index score at 3.2, followed by Las Vegas, NV, at 4.4.
Where Pre-1980 Homes Are Most Common
Homes built before 1980 are more likely to contain asbestos-containing building materials. Among the 75 metros studied, Buffalo, NY, had the largest share of pre-1980 housing, with more than 3 in 4 homes (77%) built before that year.

Las Vegas, NV, and McAllen, TX, had the smallest shares of homes built before 1980 at 18% each. The share of pre-1980 homes in Buffalo, NY, was more than four times as high. The regional differences were just as pronounced, with older housing especially concentrated in the Northeast.

In the Northeast, 70% of homes were built before 1980, nearly double the 36% in the South. The Northeast also accounted for 12 of the 20 metros with the oldest housing. Buffalo, NY, stood out within that group, with more than half of its homes (55%) built before 1960.
Where Homes Are More Likely to Sit Vacant
Housing age was only part of the index. We also looked at homes that were vacant and off the market. These homes weren’t listed for rent or sale and weren’t classified as seasonal properties.

New Orleans, LA, had the highest share of homes vacant and off the market at 7.7%, followed by Birmingham, AL (7.5%), Baton Rouge, LA (6.4%), and Columbia, SC (5.8%). Including this measure helped identify metros where older housing overlaps with a larger share of unused homes that may eventually require maintenance, renovation, or demolition.
Where New Home Construction Is Most Active
New construction varies widely across the metros we studied. In 2025, North Port, FL, had 362 new housing units authorized by building permits per 10,000 existing housing units, followed by Cape Coral, FL (307), Raleigh, NC (283), Austin, TX (262), and Orlando, FL (243).
Almost all of the fastest-building metros are young-stock Sun Belt markets, so new construction is landing where housing is already newer, not in the older metros that top the index.

The 10 metros building the most new homes averaged 26% pre-1980 housing, compared with 67% among the 10 building the least. Permits for new construction count new buildings only, not renovations or demolitions of older homes. They are shown here as context rather than as part of the index.
Staying Safe Around Asbestos in an Older Home
If you own or are considering an older home, there are steps you can take to help reduce the risk of disturbing asbestos-containing materials.
Steps homeowners can take:
- Treat materials in a pre-1980 home as potentially containing asbestos unless testing shows otherwise.
- Avoid cutting, sanding, or removing suspect materials before they are tested by a professional.
- If asbestos needs to be removed, hire a licensed abatement professional and don’t disturb intact materials when possible.
- Check guidance from your state or local agency, since asbestos rules and oversight vary by location.
What Cities and States Can Do
Homeowners aren’t the only ones with a role to play. Local and state officials can integrate policies governing how older homes are sold, renovated, or demolished. They can also help make asbestos precautions available and easier for the public to understand.

Steps cities and states can consider:
- Require or encourage disclosure for older homes, so buyers know when asbestos-containing materials may be present.
- Flag older properties during permitting so renovations or demolitions can prompt appropriate asbestos checks.
- Help homeowners access testing and licensed abatement, particularly in communities where cost may be a barrier.
- Provide clear guidance before do-it-yourself renovations disturb older building materials.
What This Means for You and Your Family
If your home was built before 1980, it’s advisable to stay informed. Some materials in the home may contain asbestos, so it’s important to avoid disturbing anything suspicious, have materials tested when needed, and use licensed professionals for removal.
If you or a loved one has been affected by asbestos exposure or mesothelioma, Mesothelioma.com is here to help. From treatment information to legal options, our goal is to make sure no family has to figure this out alone.
How We Reported This
Our findings draw on public housing data for 75 of the largest U.S. metropolitan areas, measured with the U.S. Census Bureau's American Community Survey (2020 – 2024 five-year estimates) and its Building Permits Survey (2025 annual data). From the American Community Survey, we pulled the age of the housing stock (the share of homes built before 1980 and before 1960, from table B25034), tenure by year built (B25036), median year built (B25035), and vacancy status (B25002 and B25004), all accessed through data.census.gov. From the Building Permits Survey, we pulled the number of new privately owned housing units authorized in each metro.
We combined three American Community Survey measures into a single score from 0 to 100:
- Homes built before 1980 (50% of the score)
- Homes built before 1960 (25% of the score)
- Homes vacant and off the market (25% of the score)
Each measure was scaled from 0 to 100 across the 75 ranked metros, weighted as above, then rescaled from 0 to 100.
New-construction permits are shown as context, not as part of the score. We didn't measure renovation, demolition, code enforcement, or asbestos oversight because no national records of these exist at the metro level. Home age is a proxy for the possible presence of legacy asbestos materials and should be read that way, not as a measure of asbestos in any individual home. Rankings describe the highest and lowest among the 75 metros included, not every U.S. city.
This research may be shared for noncommercial purposes with proper attribution to Mesothelioma.com.


Free Mesothelioma Treatment Guide


Tara Strand specializes in writing content about mesothelioma and asbestos. She focuses on topics like mesothelioma awareness, research, treatment, asbestos trust funds and other advocacy efforts.